

Click or scroll to zoom
Tap or pinch to zoom
Excel 2007 Charts & Tables Quick Reference
$3.60
ISBN 978-1-934433-62-1
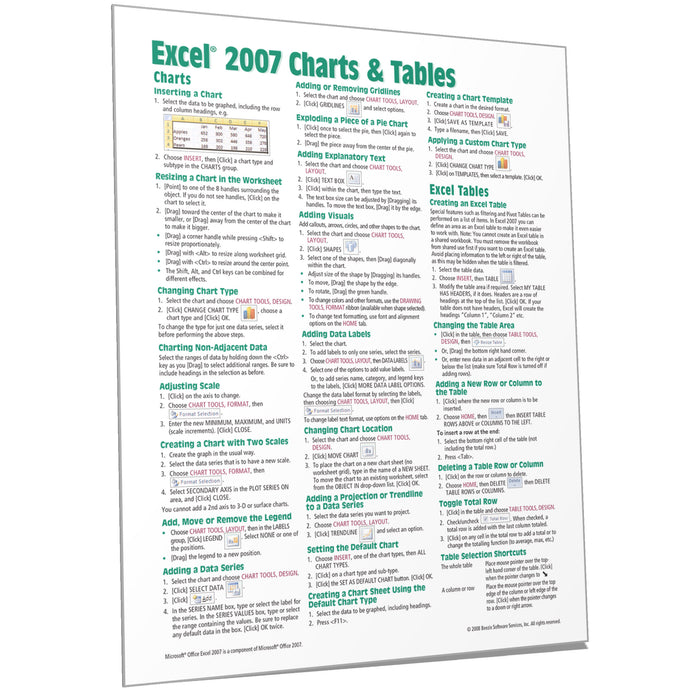
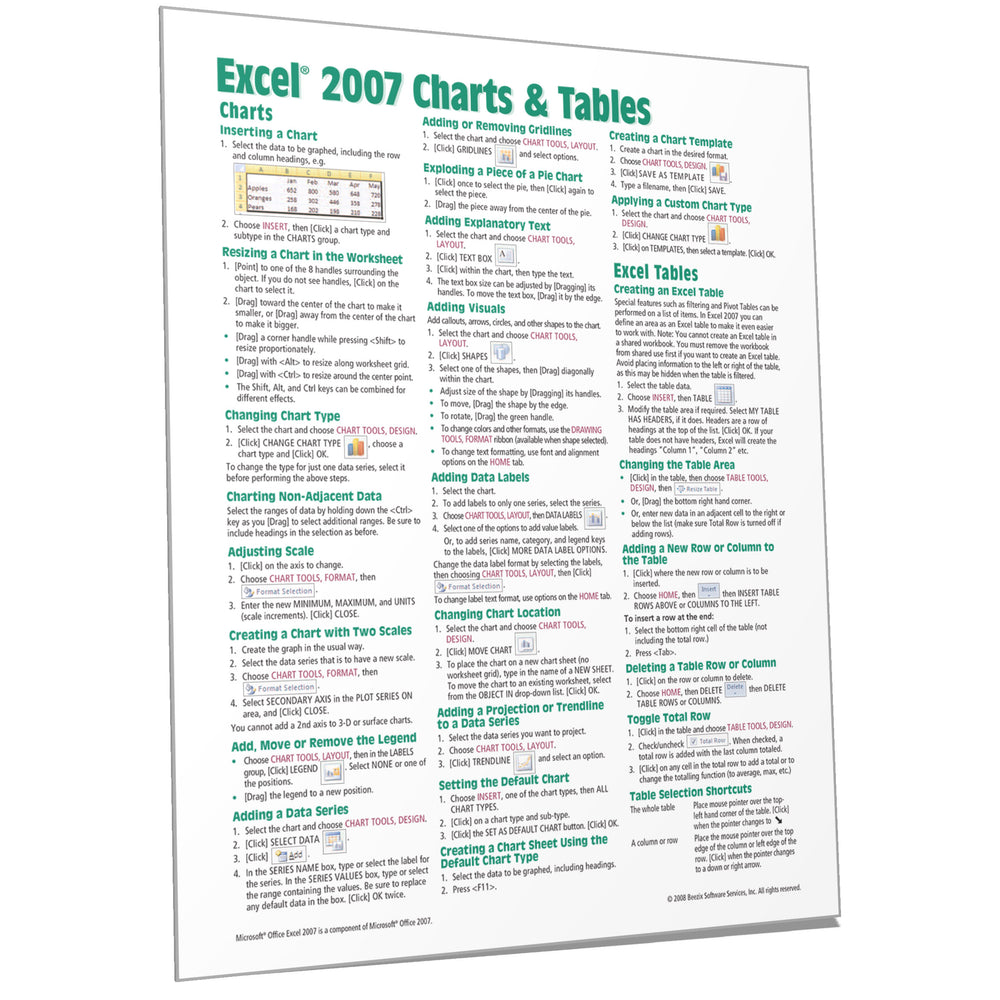
Laminated quick reference card showing step-by-step instructions and shortcuts for Charts (graphs) and Table features of Microsoft Office Excel 2007. See topics below. Need version 2010?
This guide is also available in French.
The following topics are covered:
Excel Charts -
Inserting a Chart, Resizing and Moving Chart Objects, Changing Chart Type, Charting Non-Adjacent Data, Adjusting Scale, Two-Scaled Charts Adding, Removing and Formatting: Legend, Gridlines, Data Series, Explanatory Text, Callouts, Arrows and Circles, Data Labels, Adding a Projection or Trendline to a Data Series Setting the Default Chart, Creating the Default Chart with one Keystroke, Creating Chart Templates, Applying Custom Chart Types, Changing Chart Location (Chart Object vs. Chart Sheet)
Excel Tables -
Creating an Excel Table, Excel Table vs. Normal Range, Changing the Table Area, Adding New Rows or Columns to the Table, Toggle Total Row, Table Selection Shortcuts, Sorting a List, Multi-Level Sorting, Custom Sort Orders, Subtotals Filtering a Table: AutoFilter & Advanced Filters Creating Pivot Tables, Rearranging PivotTables, Adding/Removing PivotTable Fields, Show/Hide the PivotTable Field List, Refreshing a PivotTable, Creating a PivotChart, Changing the Summary Function, Filtering in a PivotTable, Sorting in a PivotTable, Grouping by Dates or Time.